Features
- Supports historical trend visualization
- Provides alarm and event history review
- Supports multi-condition data search and filtering
- Provides Excel and CSV data export
- Supports database export and system integration
- Supports trend zoom and display configuration
- Provides horizontal and vertical trend display modes
- Supports printing of trends, reports, and event data
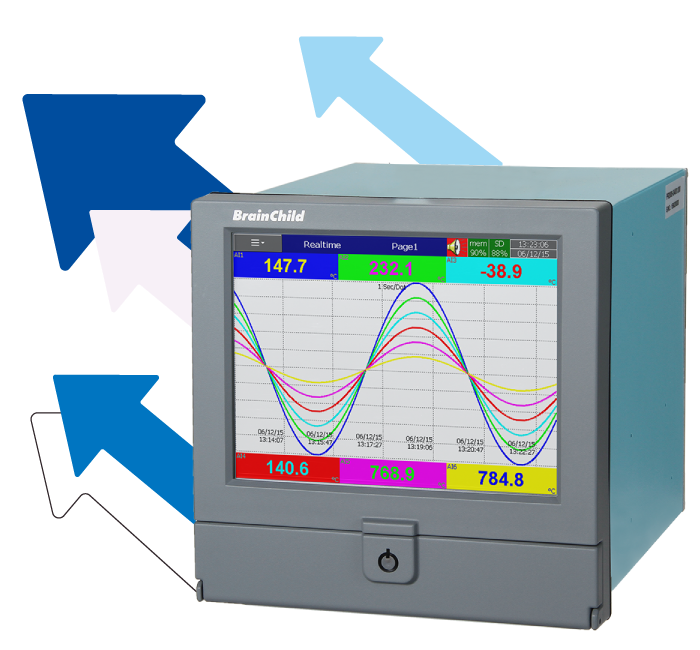
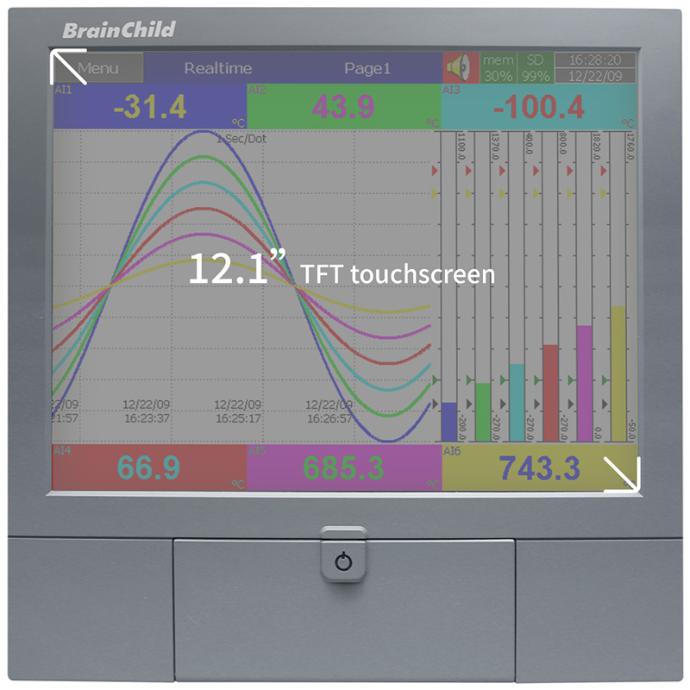
- Supports HMI historical data import
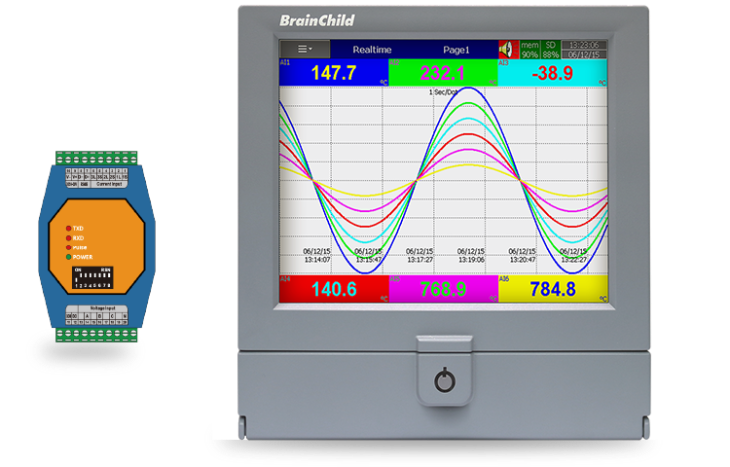
- Supports paperless recorder data import
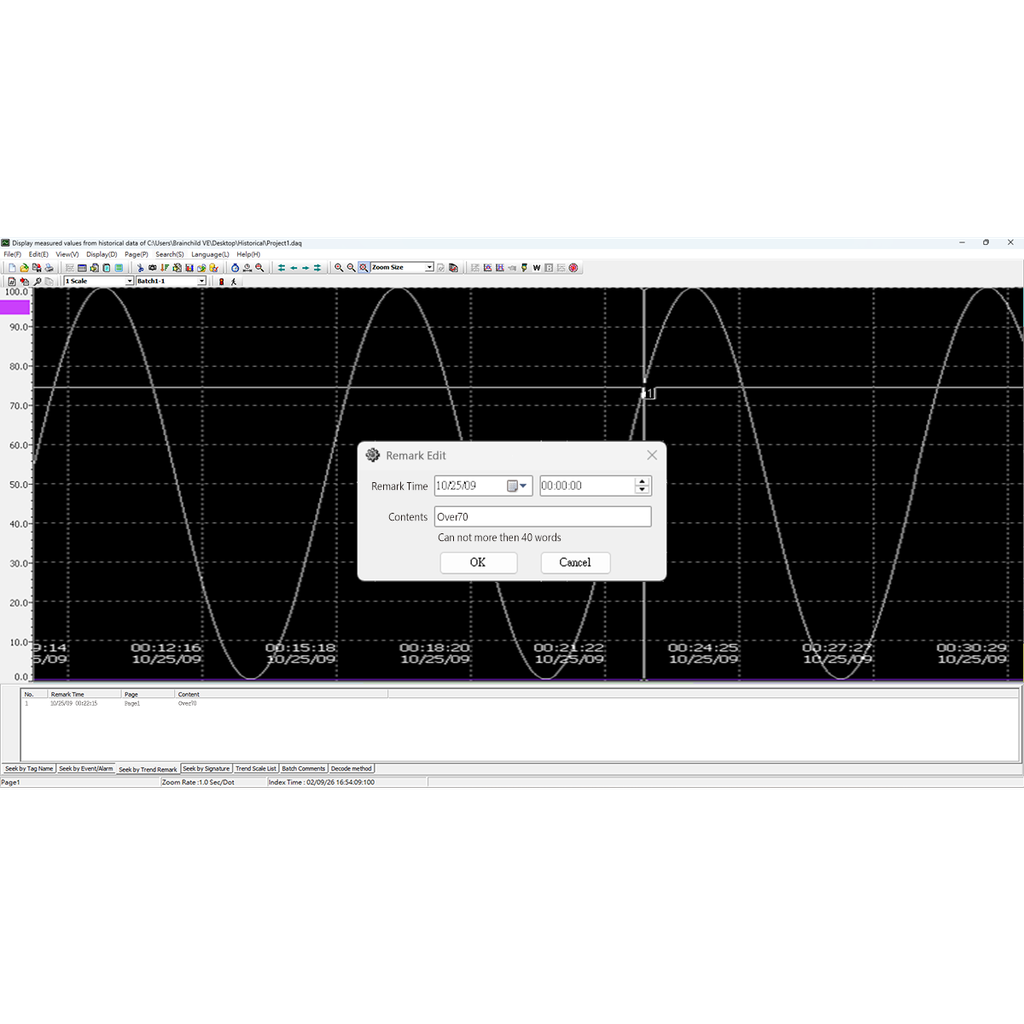
- Provides remark tagging for data traceability
- Enables centralized historical data analysis platform
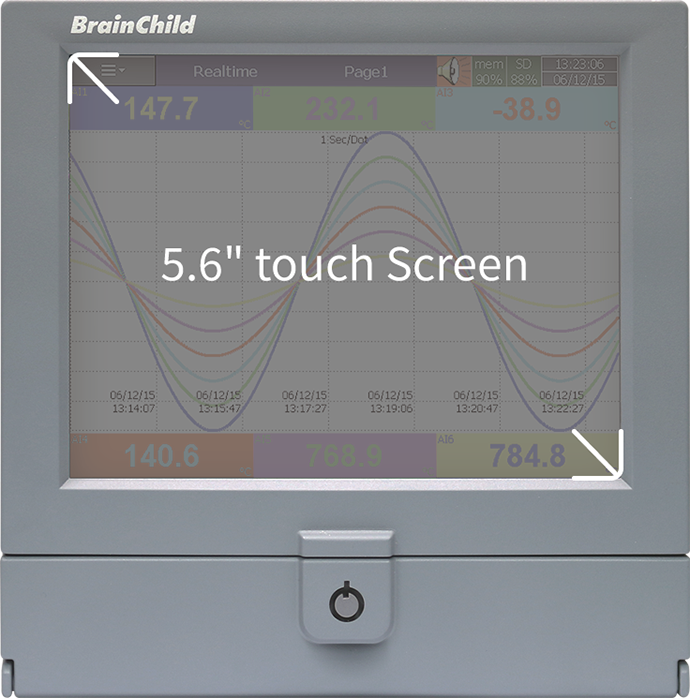
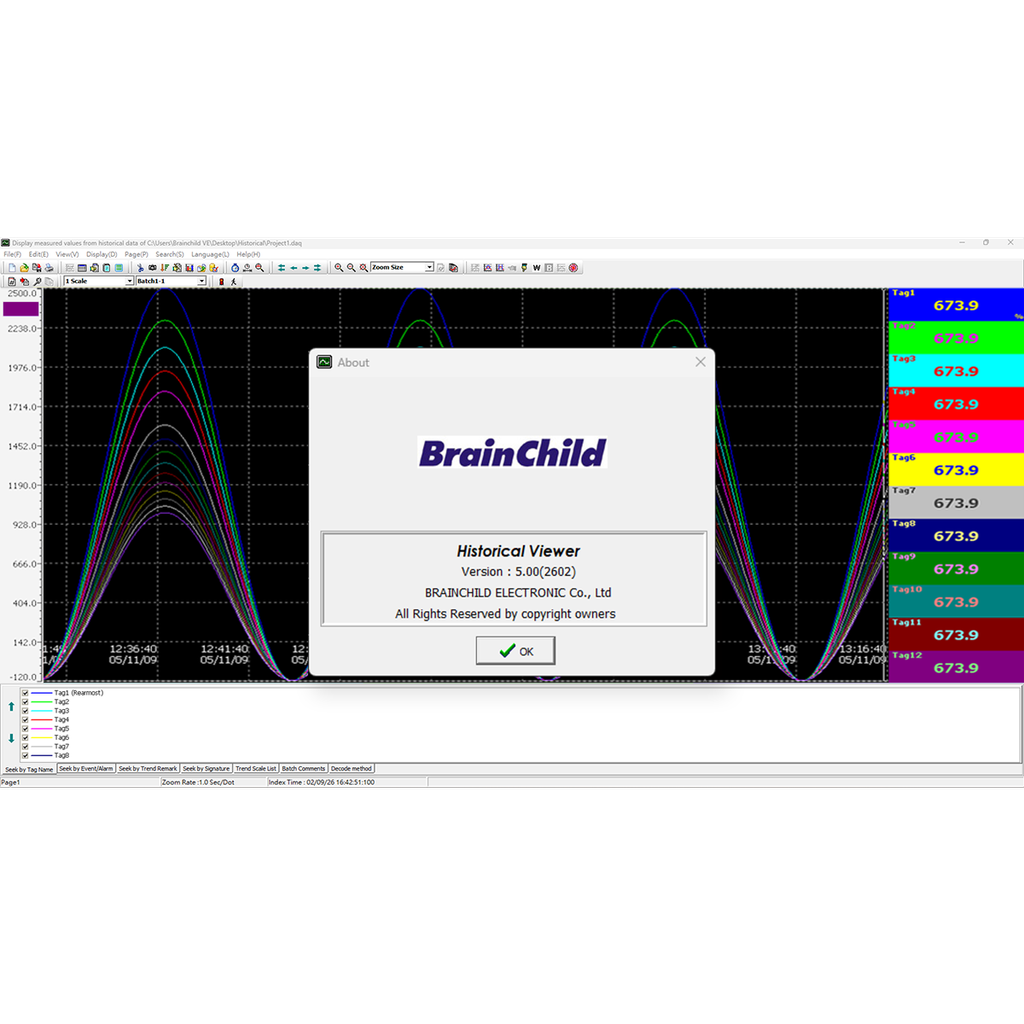
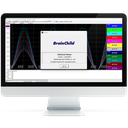
Historical Viewer
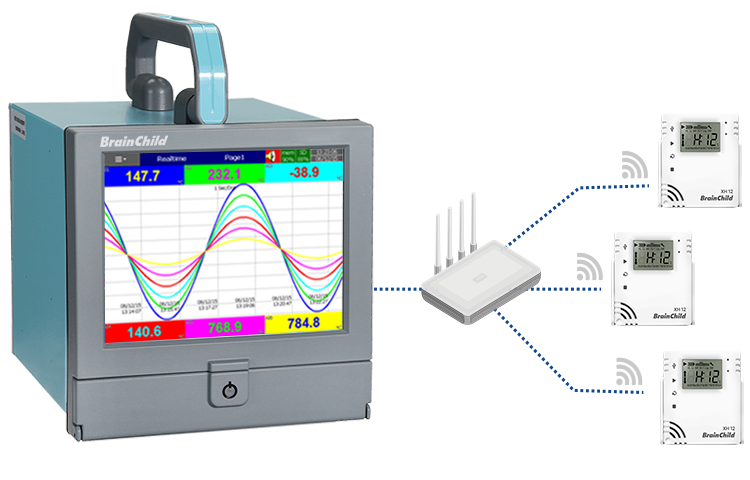
Industrial Historical Data Analysis and Process Traceability Software
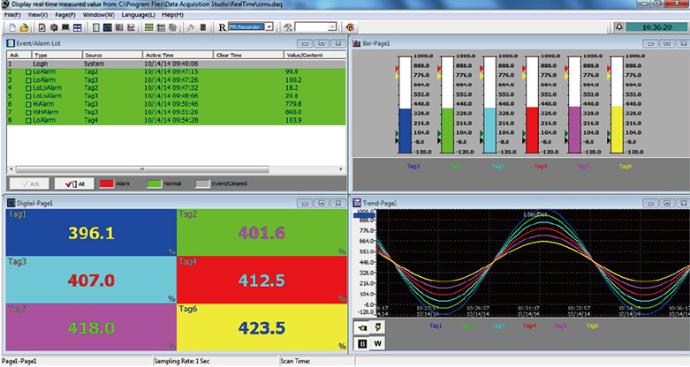
Historical Viewer is an industrial historical data visualization and analysis software developed by BrainChild. It can be used as a standalone solution or integrated with the DAQ Data Acquisition Studio system. Users can import and review historical data from HMI and paperless recorders on a PC, and analyze trends, alarms, events, reports, and value tables through a graphical interface. The software also provides data search, export, and printing functions, enabling efficient historical data management and process analysis for industrial applications such as process monitoring, quality traceability, and equipment maintenance.
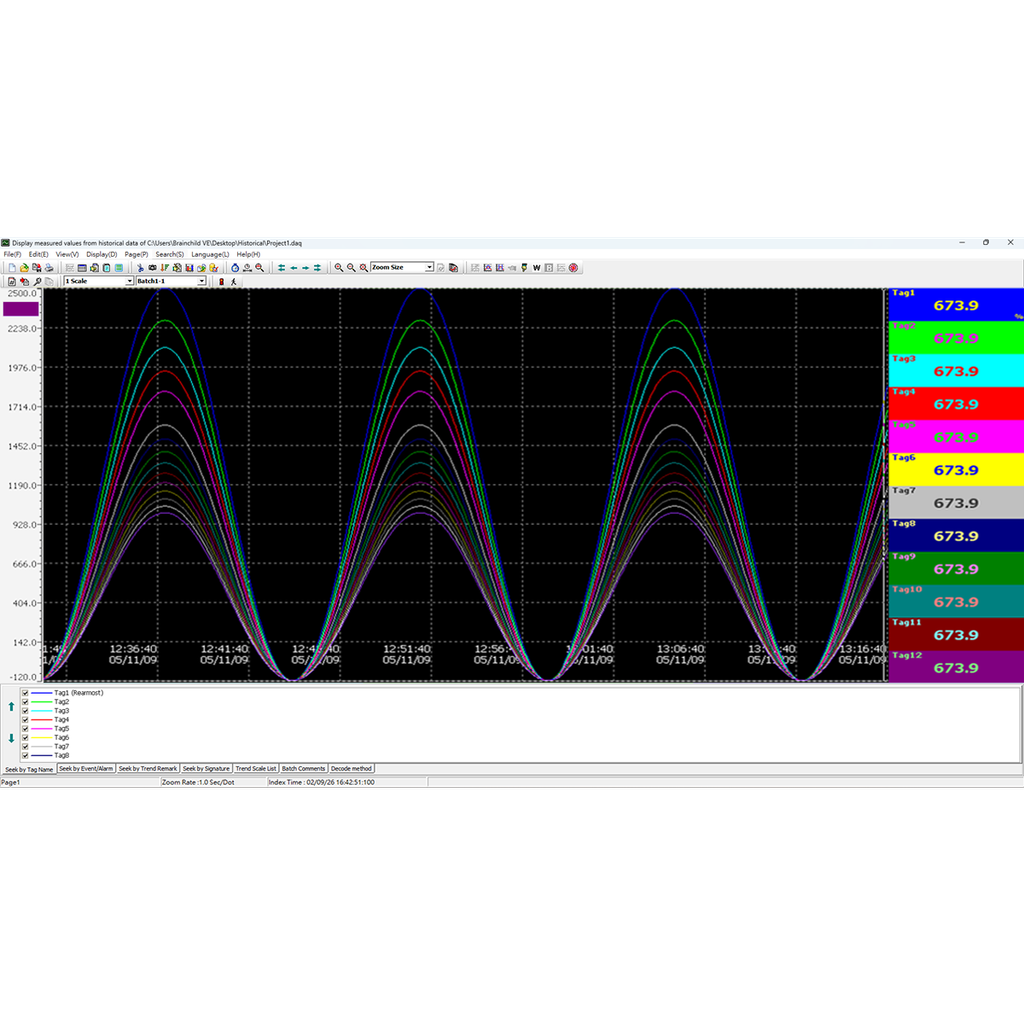
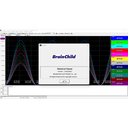
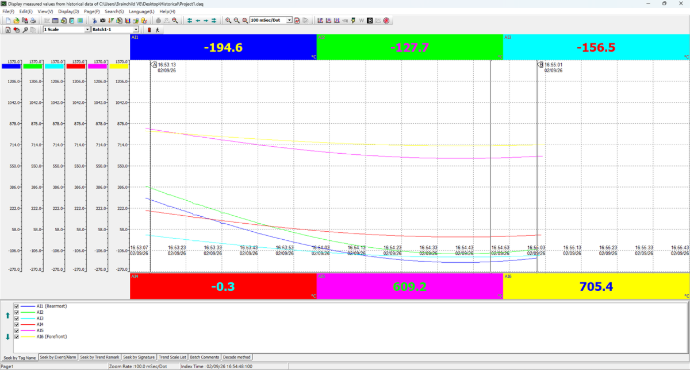
Historical Trend Visualization
Historical Viewer visualizes historical process data through trend charts, enabling users to clearly observe long-term data variations and process behavior. The software provides multiple visualization modes, including horizontal, vertical, white background, and circular views, along with zooming, display switching, and navigation functions. These flexible options allow users to adapt visualization based on application needs, making it easier to analyze process data, monitor equipment performance, and improve the efficiency and readability of historical data analysis.
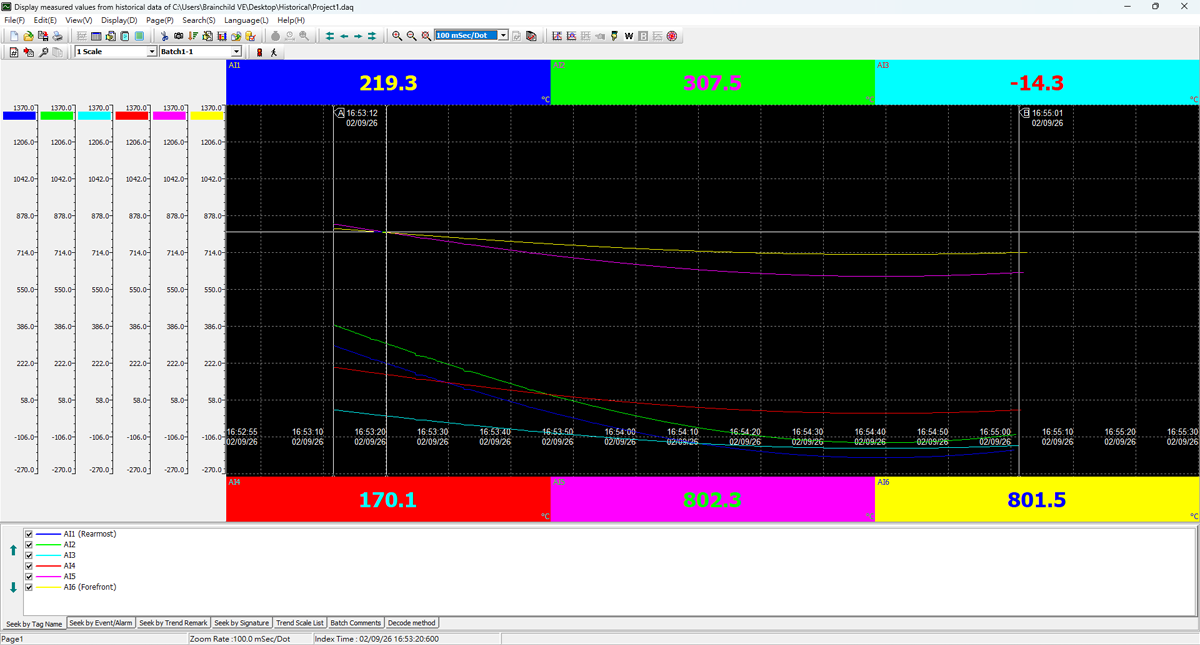
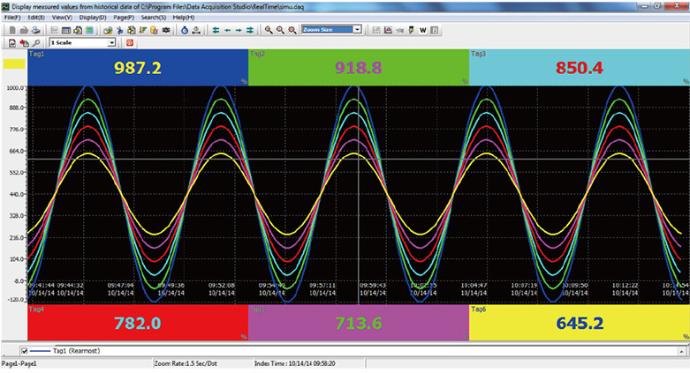
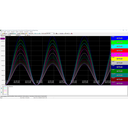
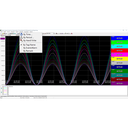
Horizontal Trend
Horizontal trend charts display data along a time-based axis, making them ideal for long-term process monitoring. Users can clearly observe data trends and equipment performance over time, supporting process analysis and monitoring applications.
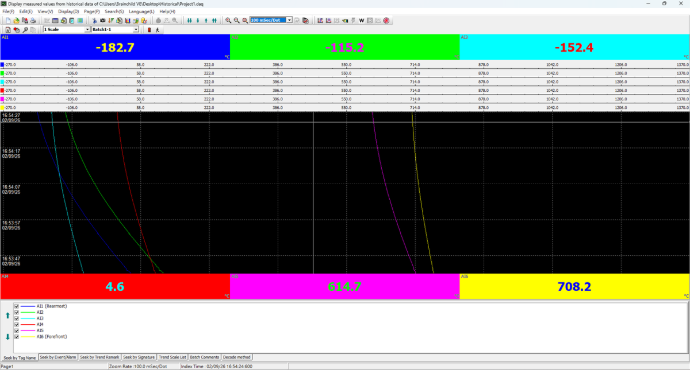
Vertical Trend
Vertical trend charts are designed for multi-channel data comparison, allowing users to quickly identify differences and variations across multiple signals, improving analysis efficiency in multi-variable processes.
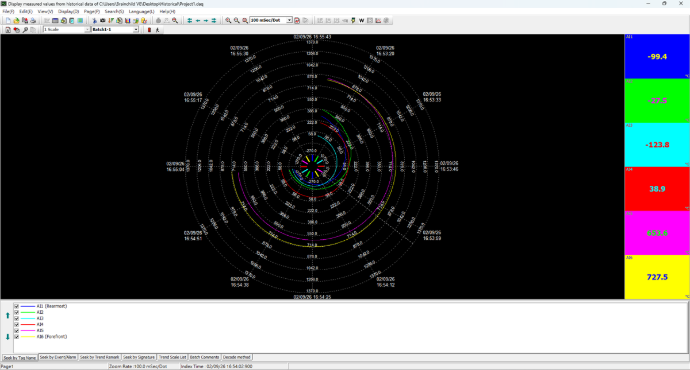
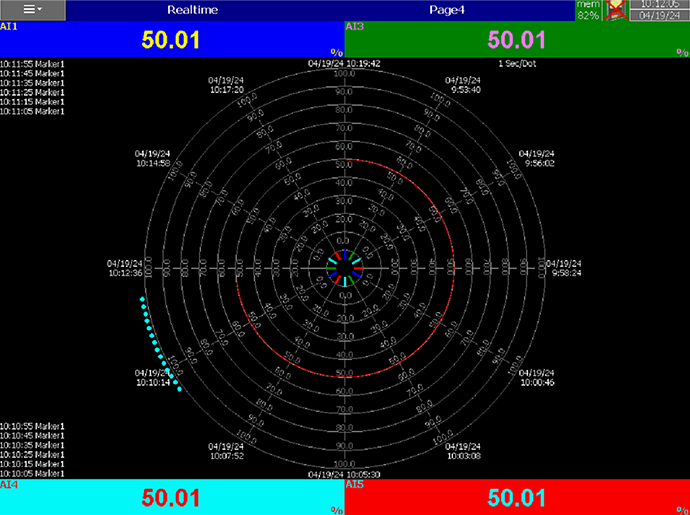
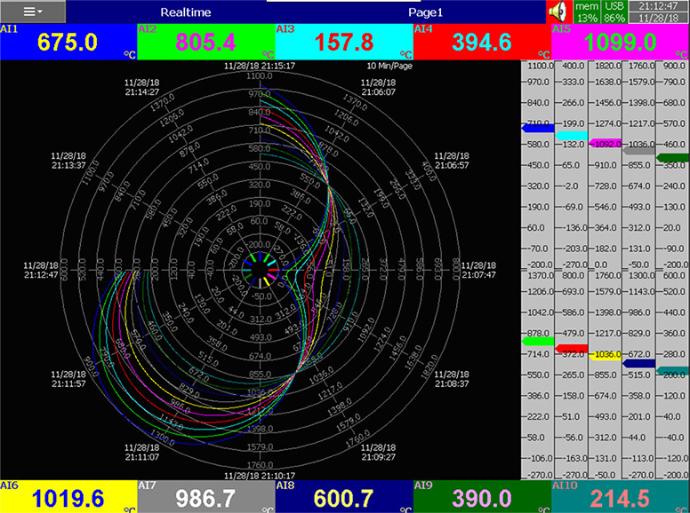
Circular View
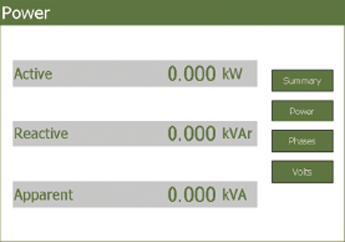
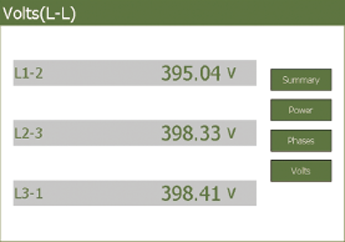
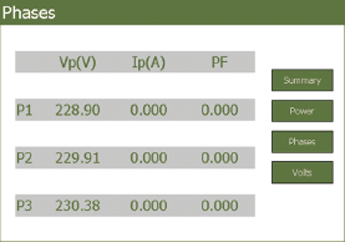
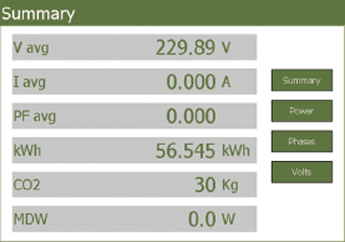
The circular view presents key data and real-time status in an intuitive graphical format, allowing users to quickly interpret equipment conditions and critical indicators for efficient monitoring. .
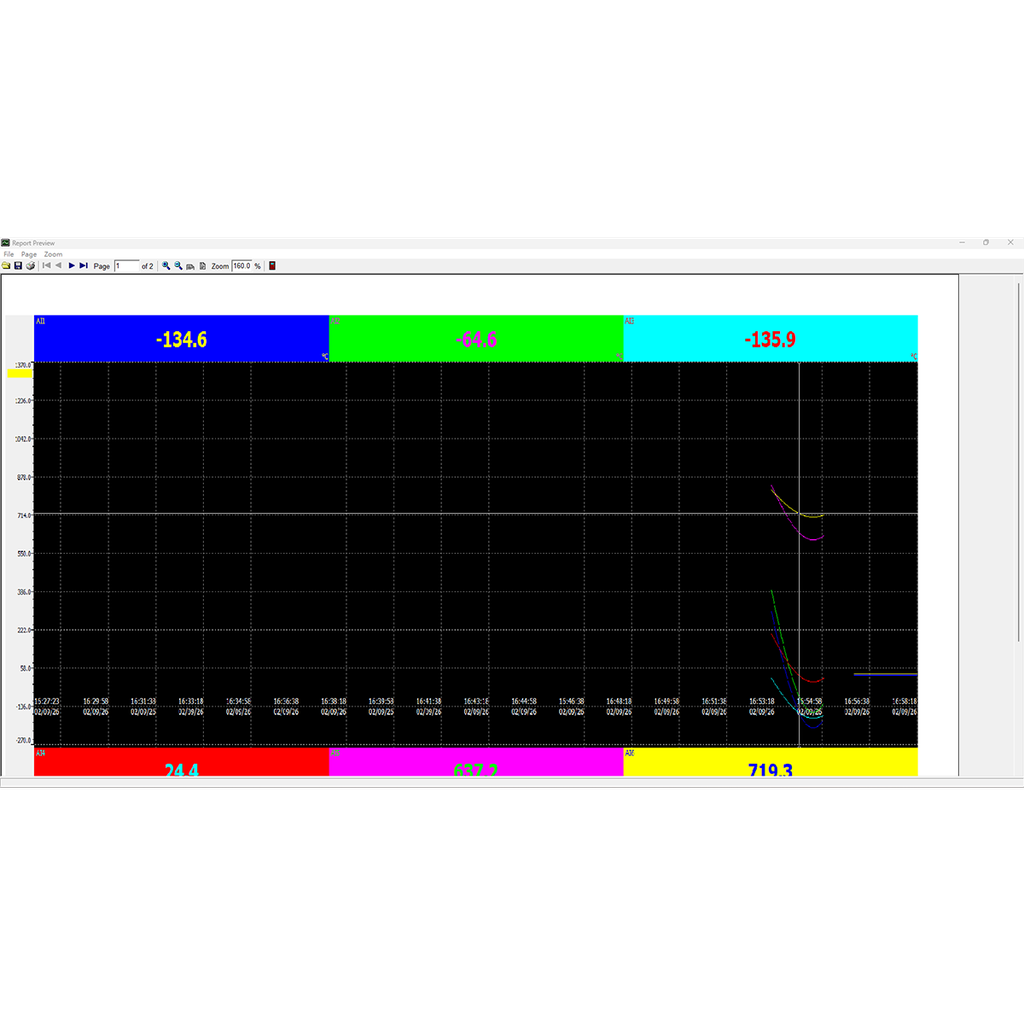
White Background View
The white background view provides a clean and clear visual layout, making it ideal for reporting and printing purposes. It enhances readability and delivers a professional presentation for documentation and analysis.
*Flexible trend visualization modes enable Historical Viewer to adapt to various process analysis needs, improving data interpretation efficiency and decision-making accuracy.
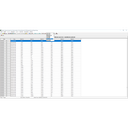
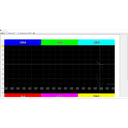
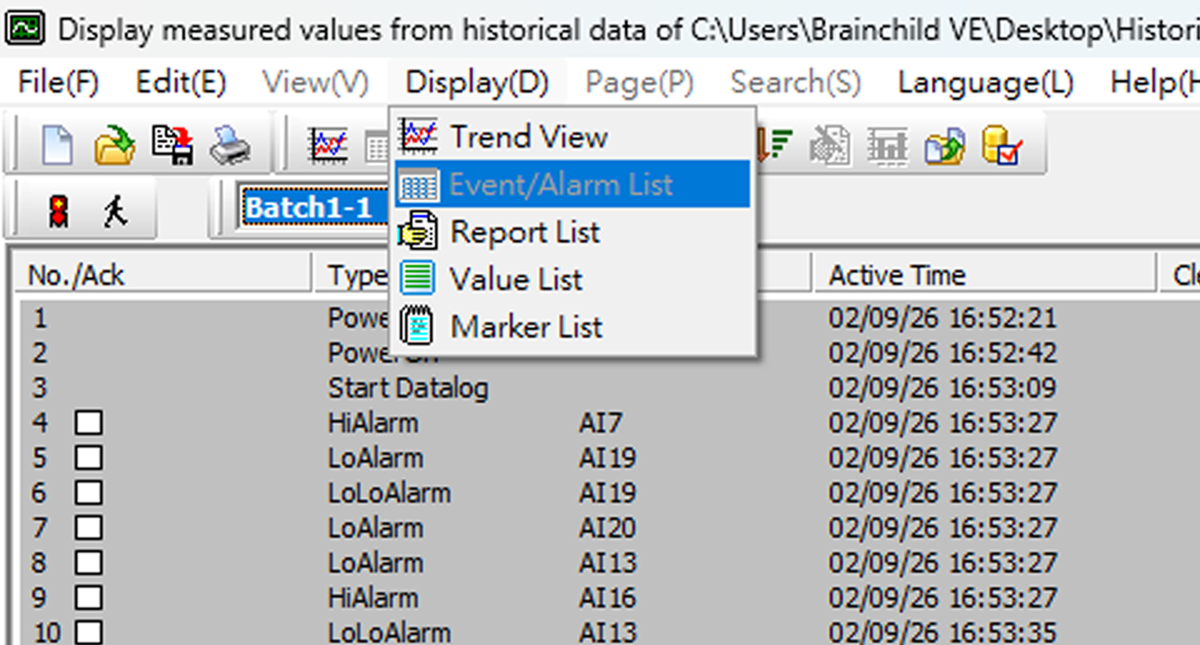
Alarm and Event History Analysis
Historical Viewer provides an Events/Alarm List that displays alarms and events based on channel configuration and occurrence sequence. Through a clear and structured list interface, users can review abnormal conditions and operational events over time, enabling engineers to quickly identify issues, analyze system behavior, and improve troubleshooting efficiency and system reliability. It is suitable for industrial process monitoring, event tracking, and equipment management applications.
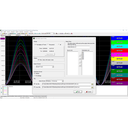
Historical Data Search and Filtering
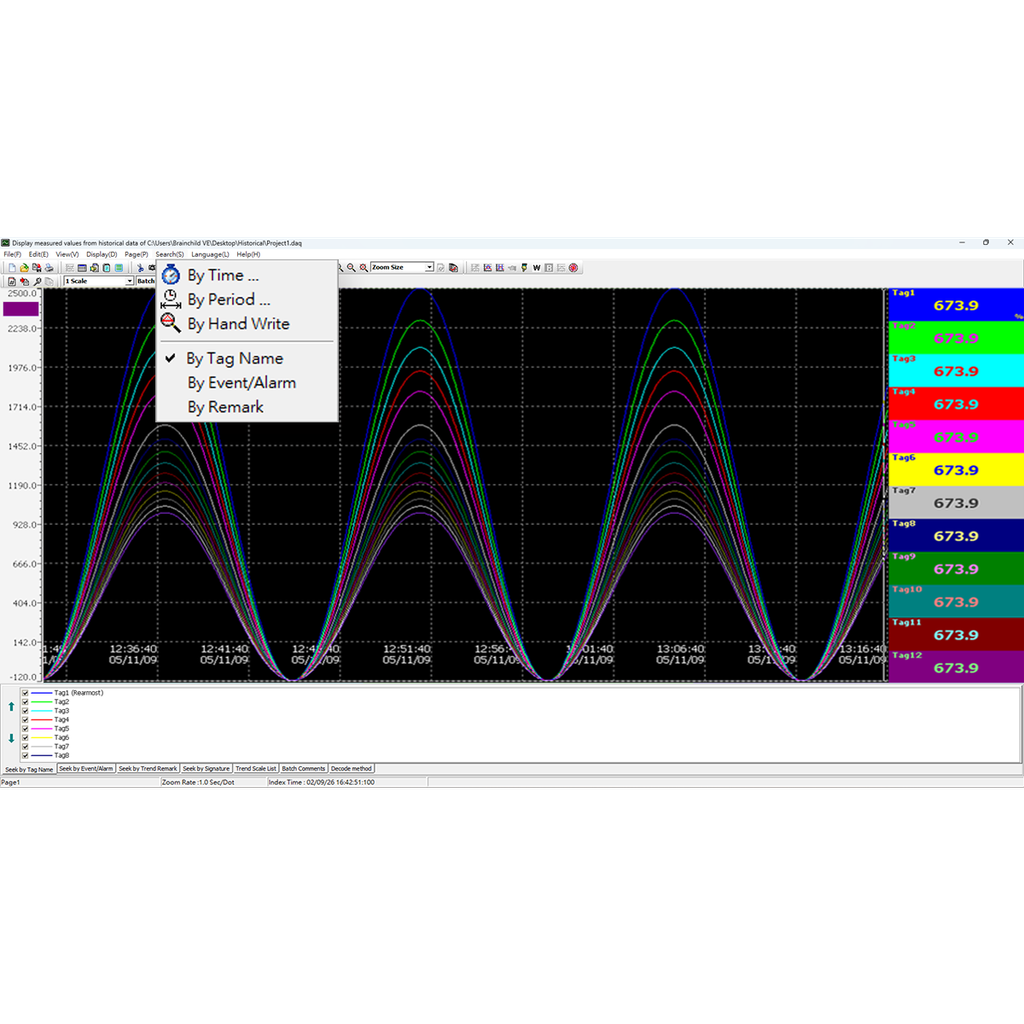
Historical Viewer supports multiple historical data search and filtering methods, including search by time, time range, tag name, event/alarm, and remark. Through an intuitive search interface, users can quickly locate specific process data and abnormal records, enabling efficient data traceability and precise analysis. These capabilities make it suitable for industrial process monitoring, event analysis, and quality management applications.
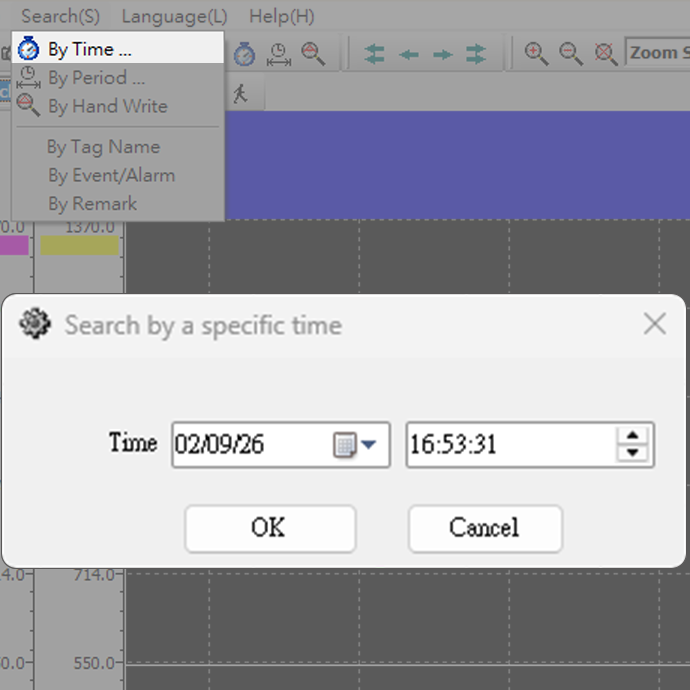
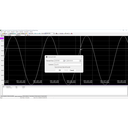
By Time
Search historical data by a specific point in time, allowing users to quickly review equipment status and process data at a defined moment.
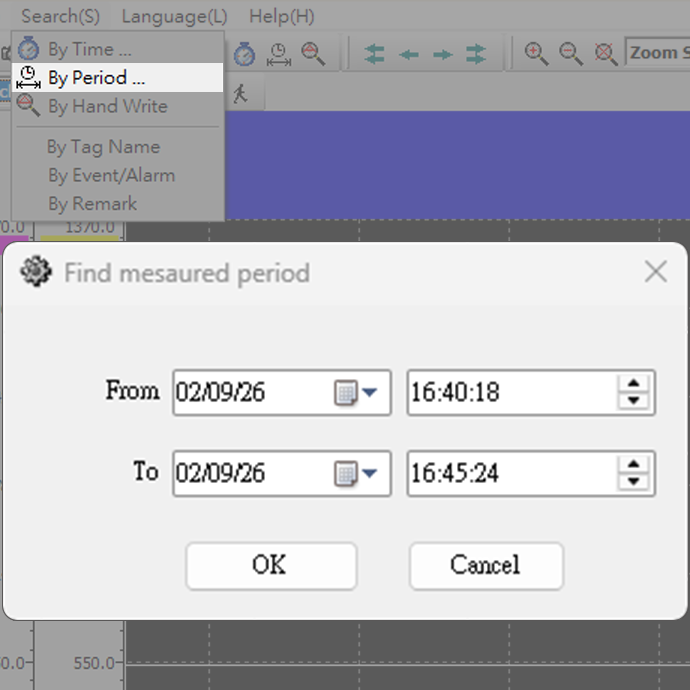
By Period of Time
Filter historical data by a defined time range, enabling long-term process analysis and trend comparison.
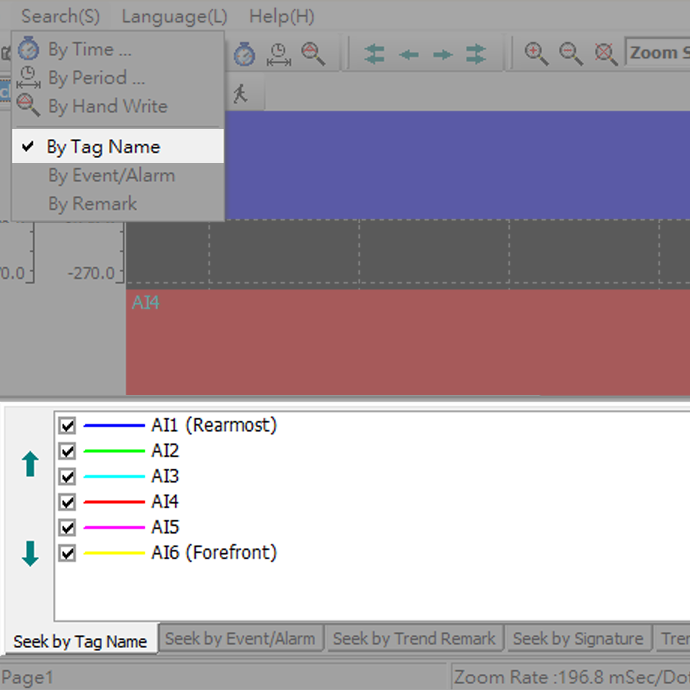
Seek by Tag Name
Search by tag name to quickly locate specific data points, improving efficiency and accuracy in multi-channel environments.
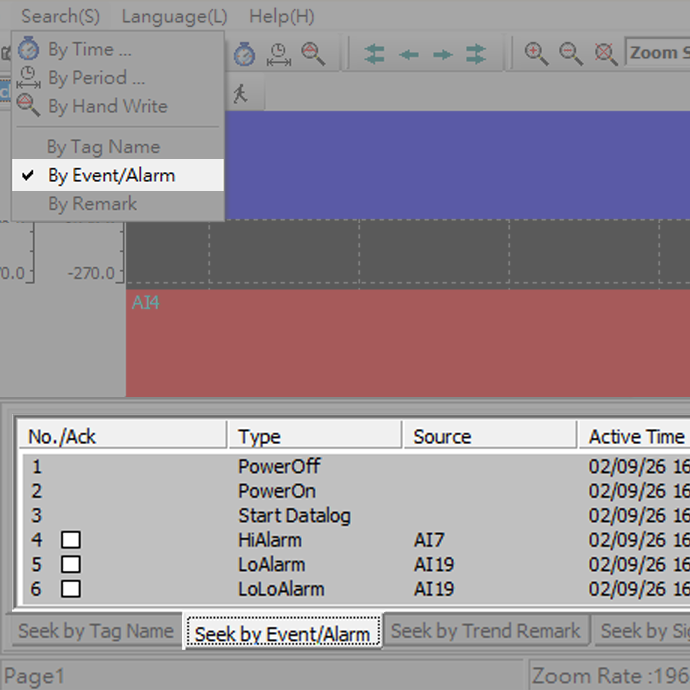
Seek by Event / Alarm
Search by event or alarm conditions to identify abnormal records, supporting troubleshooting and system analysis.
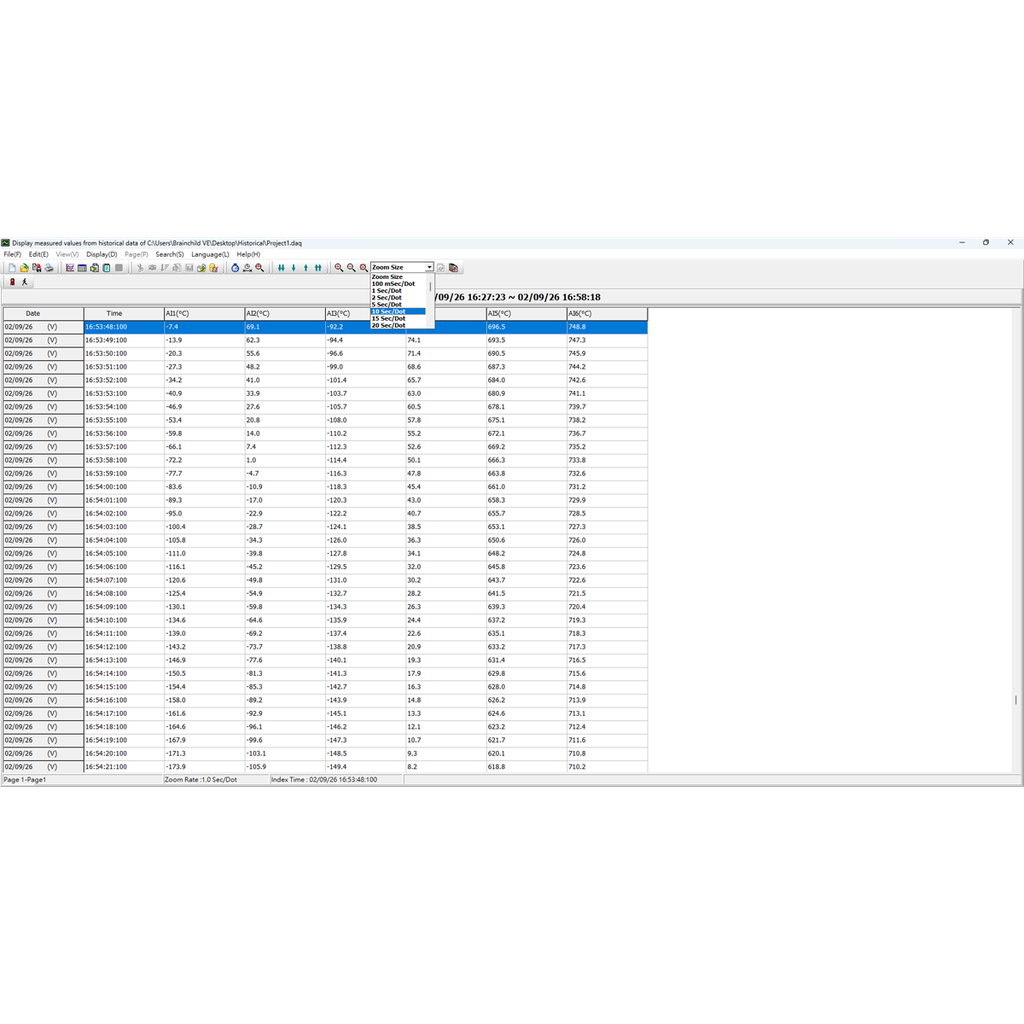
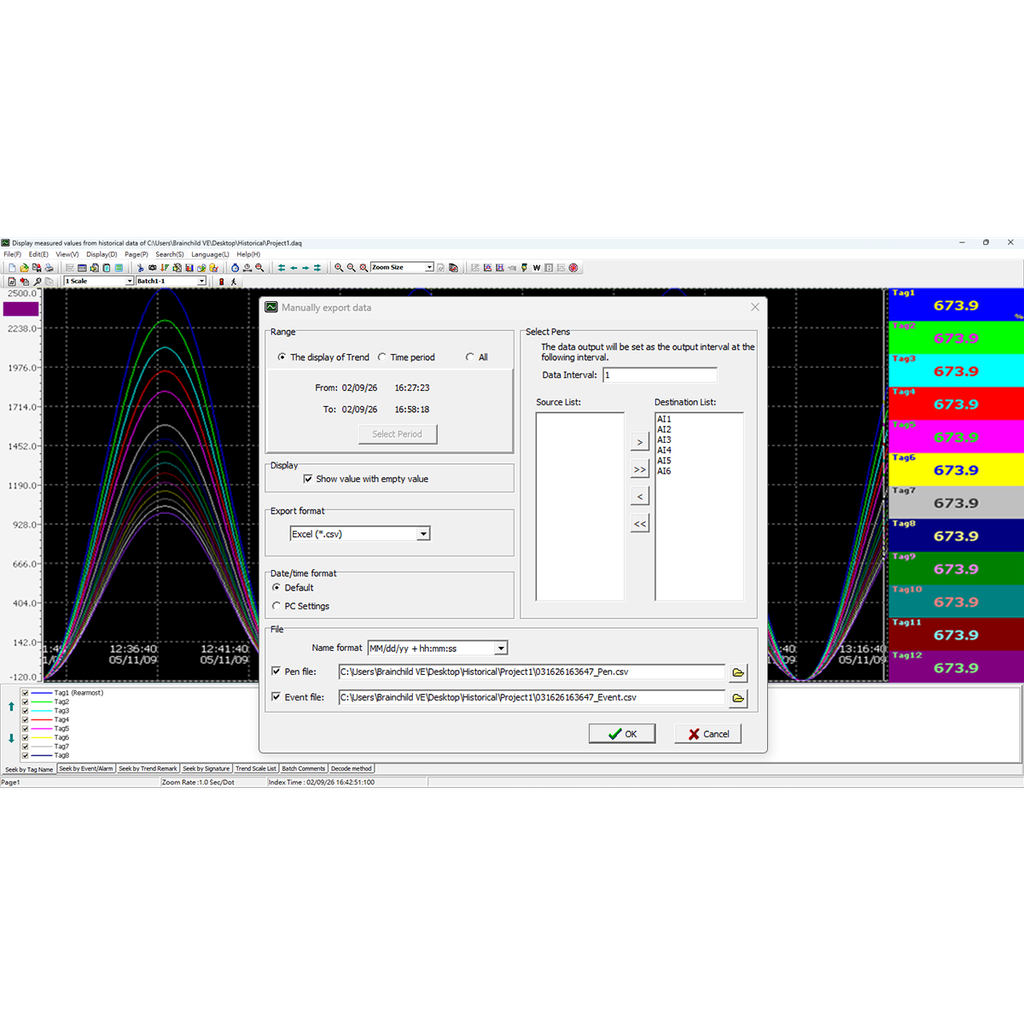
Industrial Data Export and Reporting
Historical Viewer supports data export and reporting functions. Historical data and event records can be exported to Excel, CSV, or database formats for further analysis and reporting. Trend charts, event lists, and reports can also be printed for documentation.
Download


 Historical Viewer_V5.00(2603)
Visit Download Center to See More Documents & Tools of This Product. Visit